Last updated August 25, 2021
How to make complex data visualizations accessible.
What are complex data visualizations?
Data visualizations can be an effective way to communicate complex data sets by providing a visual representation of data through charts, graphs, and maps. Data visualizations make data more accessible by presenting information in an additional format for understanding what the data represents. However, data visualizations are not always accessible to all users, especially people with disabilities.
Common accessibility barriers for data visualizations include:
- Prioritizing the visual experience without consideration for people navigating via screen reader
- Color schemes that are not accessible to people who are color blind or have low vision
- Interactive elements that are not reachable for people navigating via keyboard
Making data visualizations accessible means that users will not miss important information and that your visualization will be more understandable for everyone.
Communicating data
It is important to make sure that the data you are representing is understandable both within the context of the visualization and as an alternative to the visualization. The following sections will touch on how, why, and when to communicate data using titles and text descriptions, data tables, labels, color and pattern, white space, and interaction.
Communicate data in the following ways:
Titles and text descriptions
Be sure to add a text title and description to your visualization so users know the purpose of the visualization and what information they should be taking away from it. Provide a brief description of what the data is conveying. This text title and short description should be placed before the data visualization.
A longer text description is essential for describing the full content of the visualization. A good text description includes:
- Context for why the data visualization is useful or why it’s intended to to be used, and how it relates to surrounding content.
- More details about the patterns, trends, relationships, or conclusions the visualization is illustrating
- A link to a machine-readable format of the data, such as a CSV file
Alternative text
Your visualization should have alternative text so that people navigating via screen reader will know what the visualization is when they encounter it. Learn more about writing alt text for data visualizations.
Alt text for data visualization should include:
- The type of visualization
- The type of data
- Briefly, what the visualization is conveying
Alt text should also mention that a longer description is available in the surrounding text.
More examples of alt text and text descriptions for accessible SVGs. For an HTML tag, the alternative text is set with the alt attribute and a longer text description with longdesc. For an SVG, the title and desc elements can be used to provide text alternatives.
Data tables
Including a data table can make your data more accessible to people navigating via screen reader, as well as people accessing the visualization on a mobile device. However, providing a data table is not sufficient to make your visualization accessible — visualizations are meant to help the user make sense of the data and to illustrate trends and relationships that would not otherwise be apparent to someone reading the raw data table. Some additional considerations for including the data are:
- Ensure that you have accessible data tables when using a table in conjunction with your visualization. Learn more about creating accessible data tables.
- Link to the raw data in your description or alternative text.
Labels
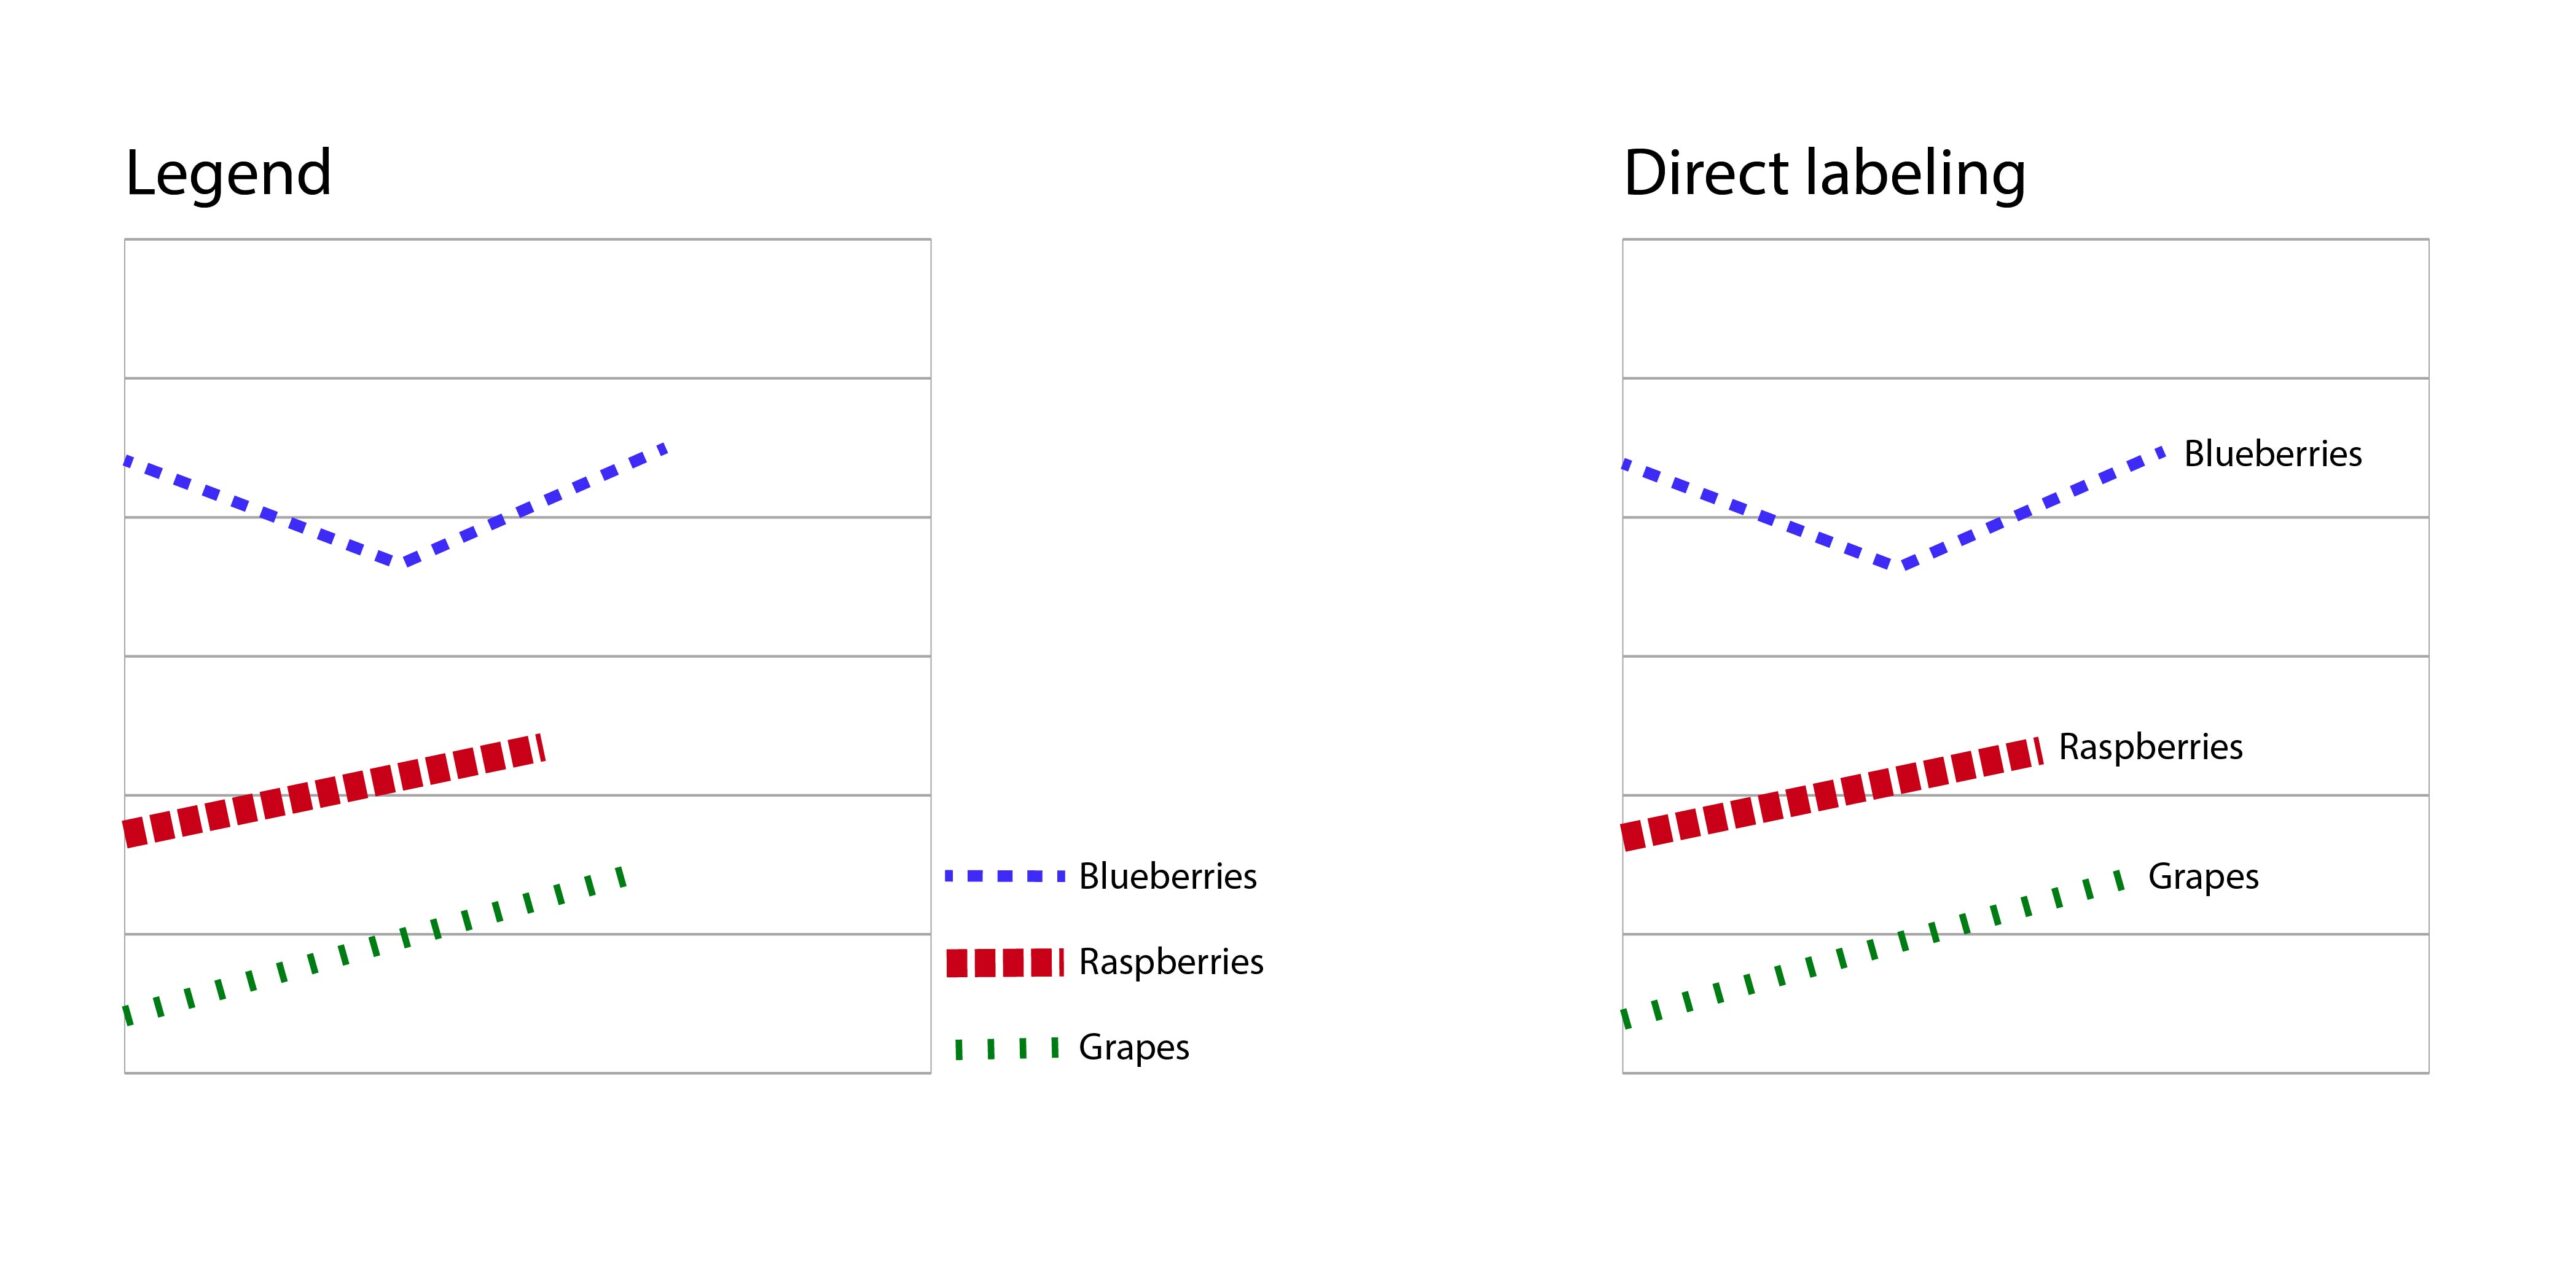
Label data directly. Having data labeled in context can make the information more accessible in a variety of ways, including not having to rely on color and not having to navigate to the legend to understand the data.

A chart with a legend vs. a chart with direct labeling.
Using color and pattern
According to the Web Content Accessibility Guidelines (WCAG 2.0), colors need to have sufficient contrast and cannot be the sole means of communicating information. The following sections will discuss accessible ways to use color and pattern in data visualizations, including considerations for contrast, white space, and pattern.
Your color scheme should have a high color contrast ratio to meet WCAG AA or AAA color contrast accessibility standards. Your color scheme should also be accessible to people who are colorblind. Learn more about color palettes and accessibility features for data visualization. Here are some additional steps you can take to ensure color contrast accessibility:
- Use a color contrast checker to ensure high enough contrast ratios
- Use tools such as Colorsafe to create an accessible color palette
- Use a simulator such as Coblis to see what your color scheme might look like to someone who is colorblind
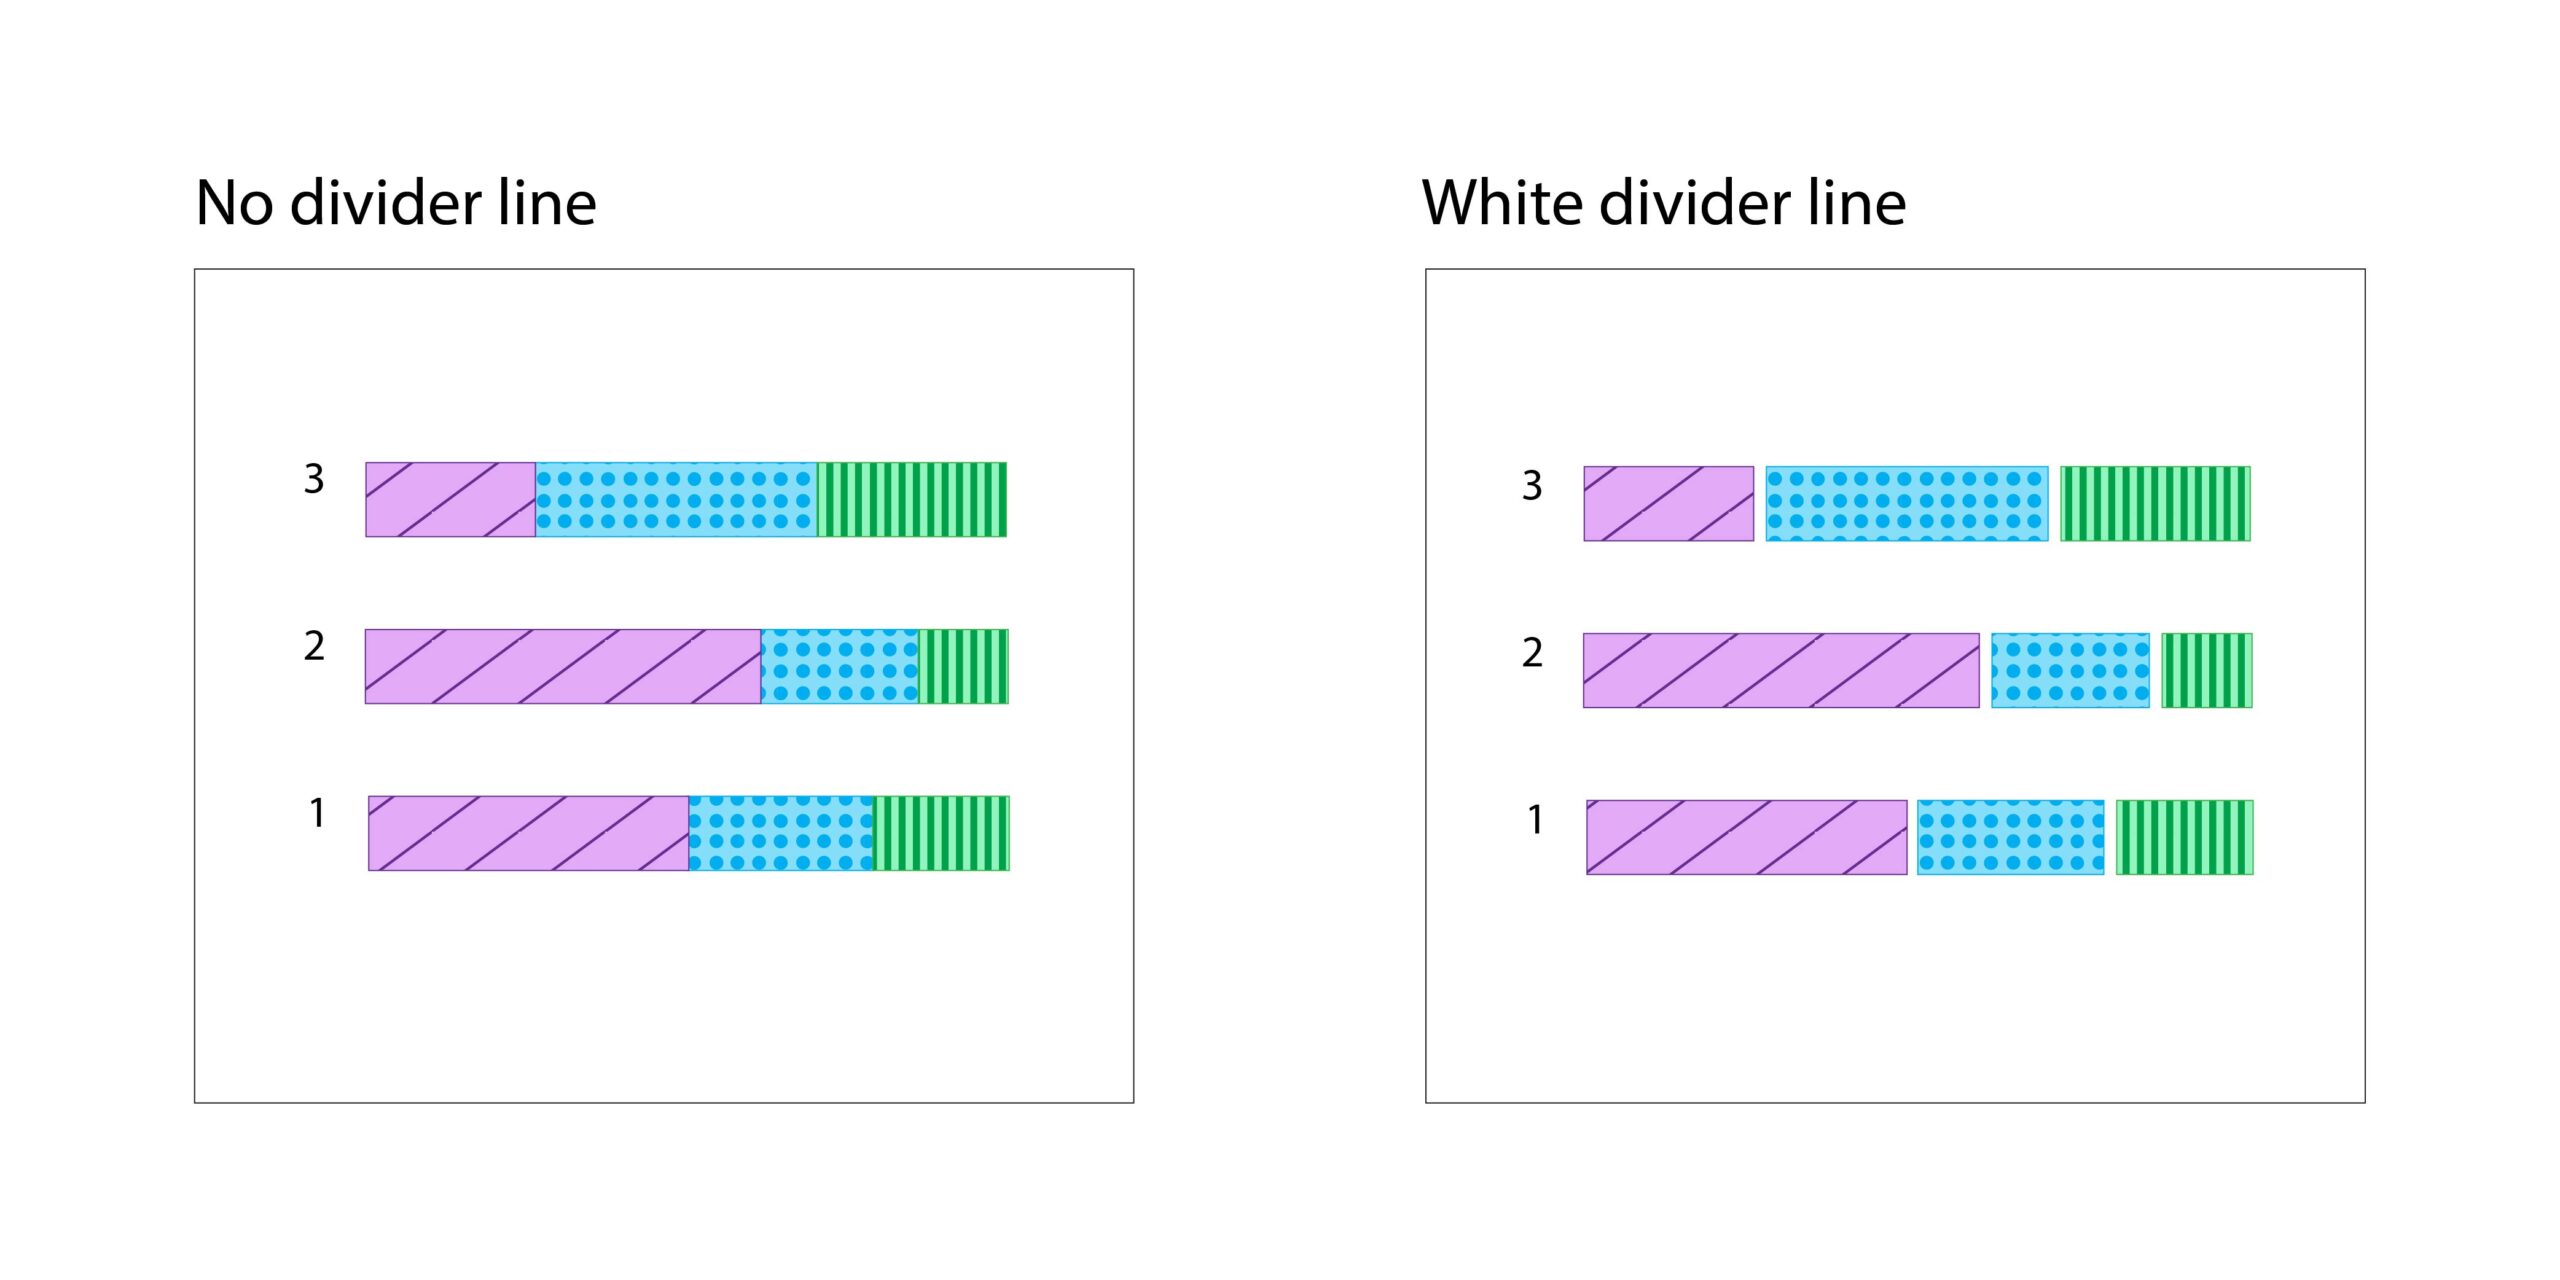
White space can help distinguish elements of your visualization, and prevent confusion based on color. The following bar charts illustrate the difference between a chart with no divider line, and a chart that uses a white divider line to distinguish all three colors in the bar chart.

Trying to communicate an aspect of your data exclusively through color means that some people might miss the information that you are trying to convey.
- Do not communicate exclusively with color. For example, you can add patterns and shapes to graphs to make items distinguishable without having to rely on colors. How to add patterns to graphs with D3.
- Have an accessible legend that explains the use of color in your graph. How to create an accessible legend with D3.
Interaction and animation
- Any action that you can perform on the data visualization with a mouse should also be able to be performed when navigating via keyboard.
- Avoid flashing animations that could trigger seizures.
Don’t make important information, such as labels or legends, only available on hover over. This is difficult to access when navigating via screen reader or keyboard, or on mobile devices. Accessibility tips for content on hover or focus.
The Center for User Experience
At the Center for User Experience, we are committed to working with you to make digital spaces more accessible, usable and inclusive for all students, faculty and staff at UW–Madison. We help the university follow its Digital Accessibility Policy by offering free evaluation and consultation services to all UW–Madison community members.
Get in touch
- Meet with us: Book a quick chat with one of our team members to ask any questions you have.
- Start a project with us: We support accessible design and development. Fill out our Let’s Connect form to begin working with us on your project or to request an accessibility evaluation.
- Email us: Not sure if you’re ready to meet? Email us to start talking and figure out what to do next.